
September 15, 2026 · 18 min read
Data Analyst Portfolio: What a Reviewer Opens First
The review lasts under a minute and almost none of it is reading. What a hiring reviewer actually does in that minute, why the Google capstone project now works against you, how to write a project up so it makes a claim, and what to do about the analysis your employer owns.
Somebody is going to open your portfolio from a link in a LinkedIn profile or the header of a CV, on a laptop, between two meetings, with eleven other candidates in a tab group. They are not going to read your About page. They are going to click the first project, and within a few seconds they will have decided whether you are someone who can find a problem and answer it, or someone who has completed a course.
Almost every guide to building a data analyst portfolio describes the artefact — an About section, three to five projects, a skills list, a link to GitHub. Very few describe that opening minute, which is the only part that actually decides anything. This guide is written backwards from it: what a reviewer does, in what order, and which specific decisions on your part survive the encounter.
It assumes you can already do the analysis. The gap this closes is not technical. It is that the evidence of your competence is currently sitting in a notebook that renders as raw JSON, or behind a corporate login, or inside a project that four hundred thousand other people have also completed.
What the reviewer actually does
The sequence is remarkably consistent, and nearly none of it involves reading.
They arrive from a link, not from a search. They scan the top of the page for the shape of the thing — is this a real site, or a directory listing? They click the first project, because the first project is the one you chose to put first and is therefore your own claim about your best work. They look at the top of that project for a chart and a sentence. If the sentence tells them what the analysis found, they scroll. If the page opens with "Import libraries" and a wall of `pip install` output, they go back and try the second project. If the second project also opens that way, they close the tab.
Three things follow from this, and they are worth more than any tool you could add to your skills list.
Your first project is your portfolio. Everything after it is corroboration. If you have one genuinely good piece of work and two weak ones, the ordering of those three matters more than the existence of the weak two.
An unrendered notebook is a dead end. A raw .ipynb on GitHub usually renders, but it renders as a document that opens with imports and ends with an unformatted dataframe. A repository with no README is worse: the reviewer lands on a file tree. Neither is a portfolio. They are storage.
The top of each project page has one job — to state the question and the answer before anything else. Not the dataset, not the tooling, not the cleaning. The question and the answer.
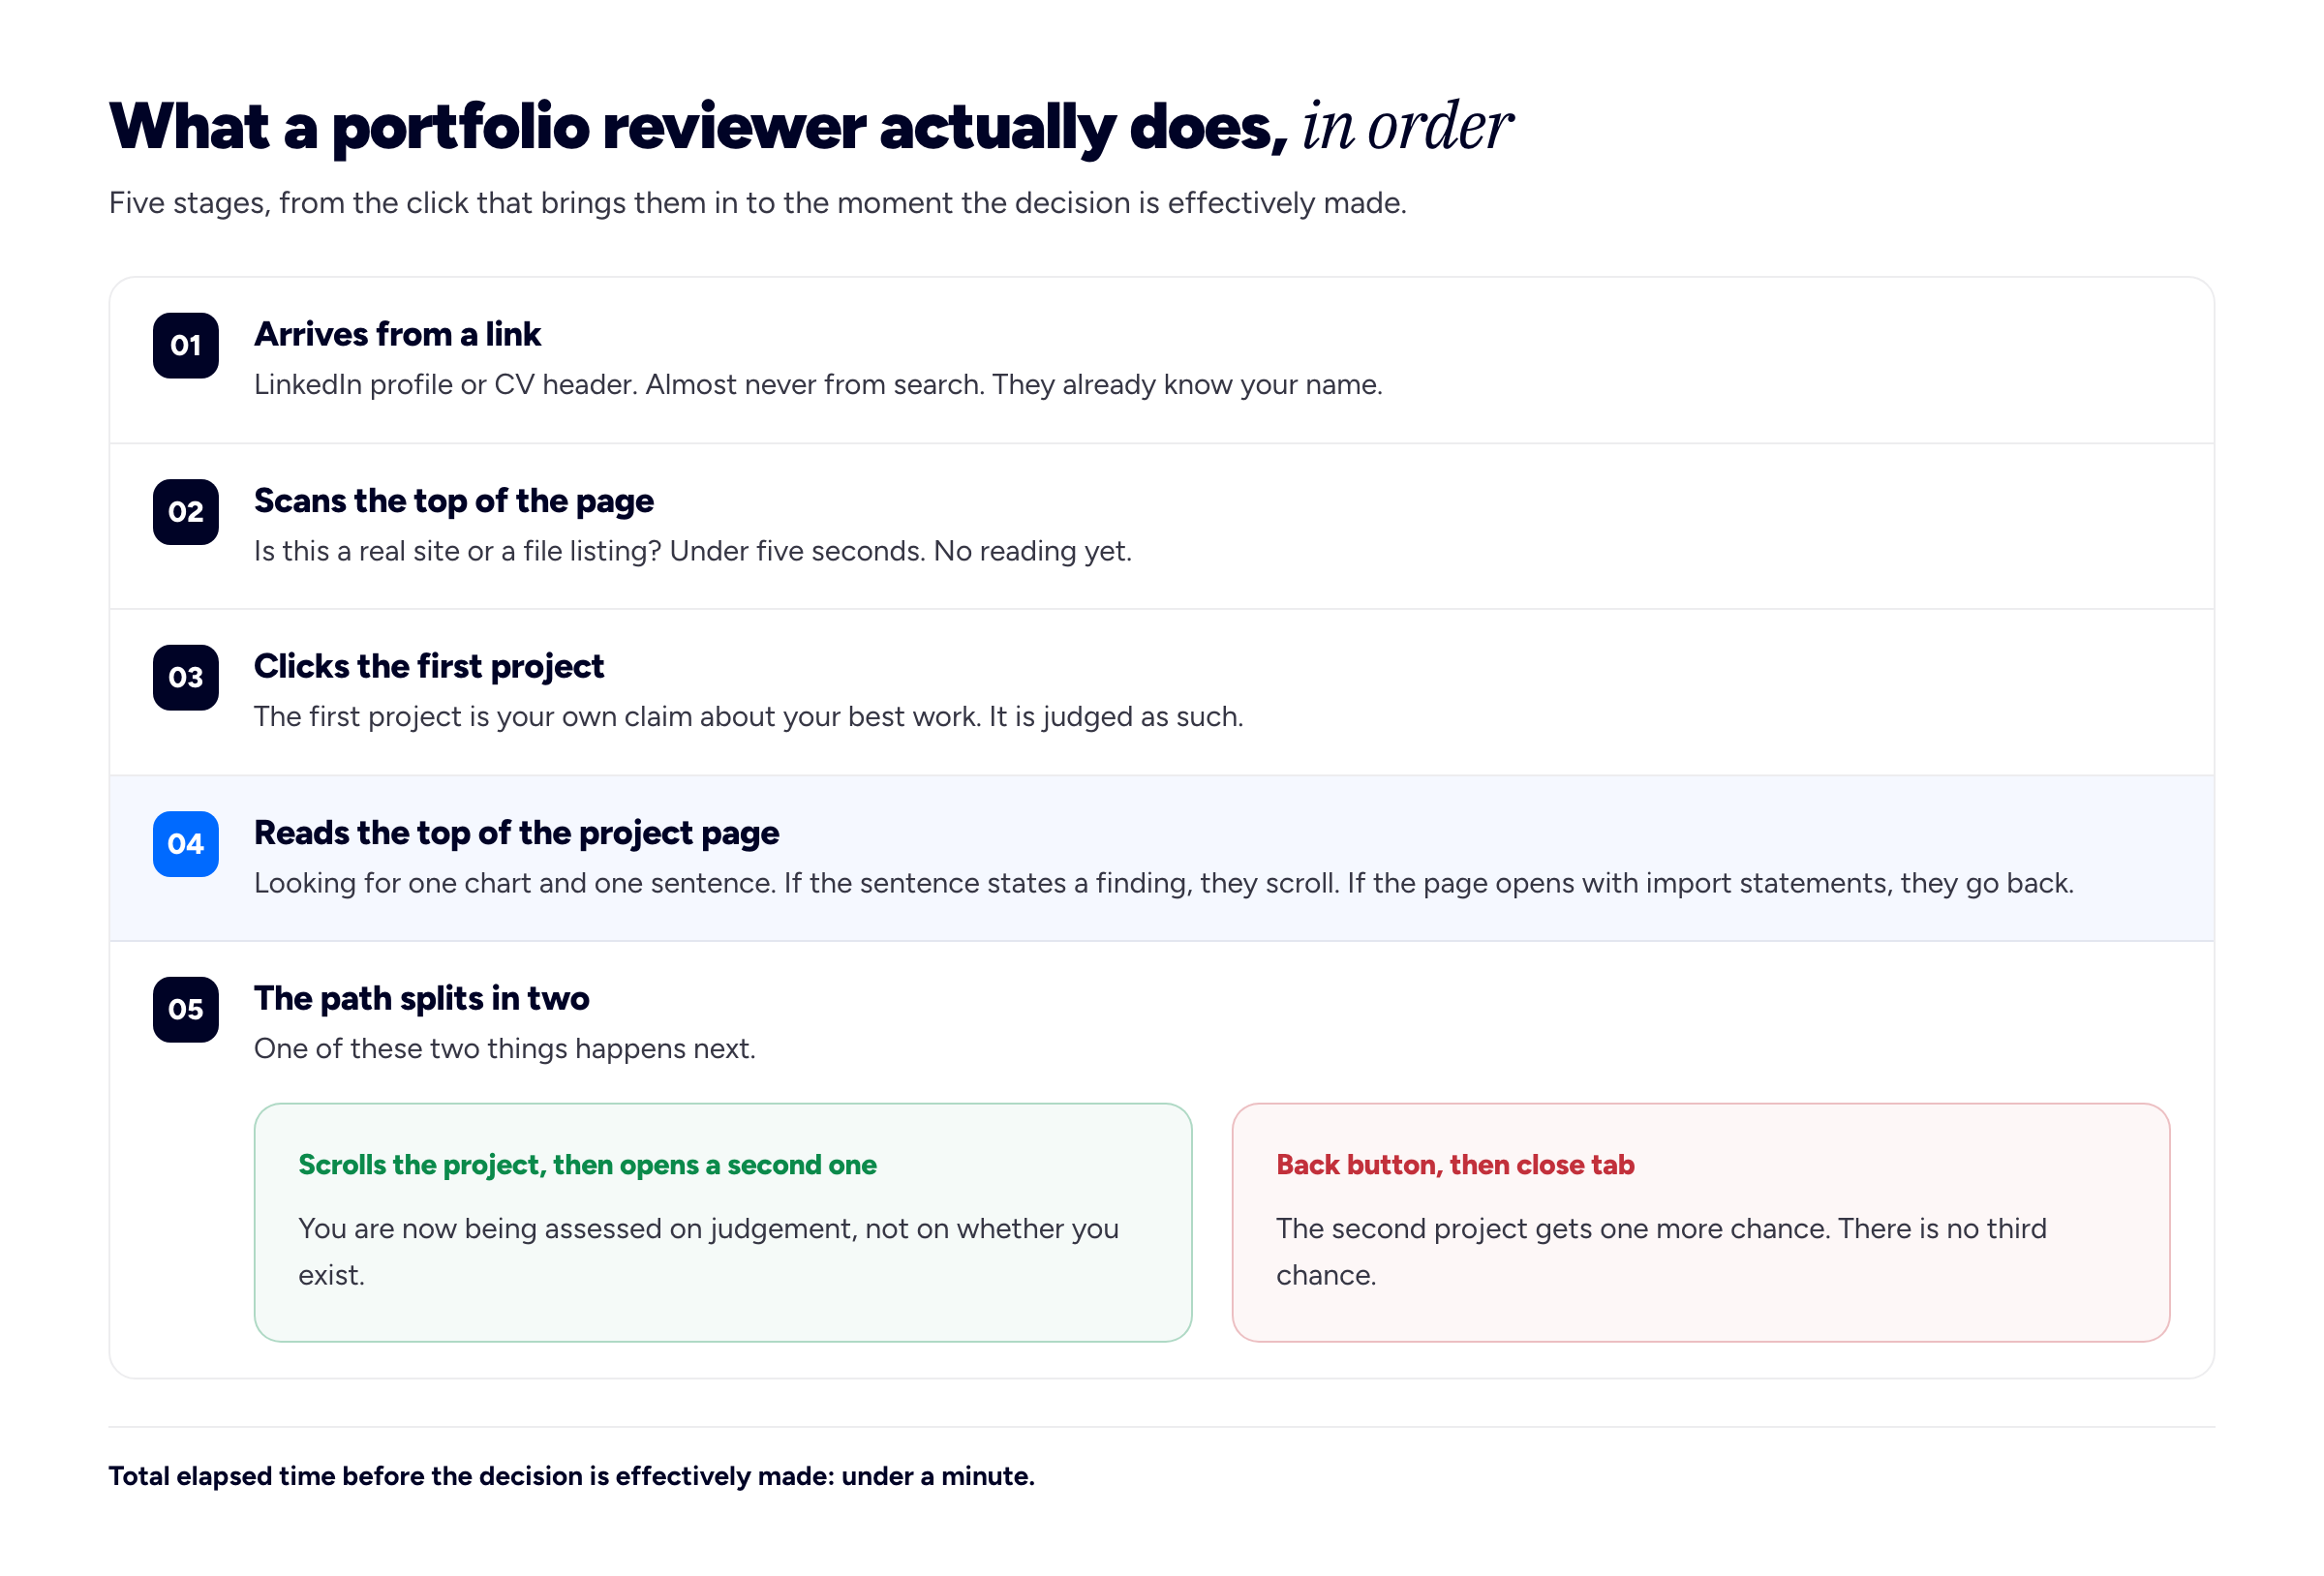
The review is short, unsentimental and mostly non-verbal. Design the first screen of the first project for it.
The Cyclistic problem
This is the most useful thing in this guide, and no competing article will tell you, because most of them are published by course providers.
The Google Data Analytics Professional Certificate ends with a capstone. Its course page on Coursera shows, at the time of writing, 729,292 people enrolled, and the capstone offers two tracks. Track A is a guided case study with two options: a bike-share company called Cyclistic, and a wellness company called Bellabeat. Track B asks you to find your own public dataset and build your own case study.
Track A is easier, so Track A is what most people do. The result is that a reviewer who hires analysts has seen the Cyclistic bike-share analysis so many times that its title alone carries information — and the information is "this person completed a popular certificate", which is not the same as "this person can analyse something". The same applies to the Titanic survival classifier, the Iris dataset and the Ames housing regression. As Vinod Chugani put it for Statology, these projects say "I followed the tutorials" — they do not say you can find a problem, source the data and decide what matters.
None of this makes the certificate worthless. It is a perfectly good way to learn, and the analysis you did was real work. The problem is purely one of signal: a project that hundreds of thousands of people have submitted cannot distinguish you, no matter how well you did it.
What to do about it, in rough order of effort:
- Take Track B instead, if you have not done the capstone yet. Same certificate, same credential, a project nobody else has.
- Keep the guided project but move it down the page, and make sure it is never the first thing a reviewer clicks. It demonstrates completion. Let it do that job quietly.
- Re-cut it around a question the course did not ask. The dataset is fine; it is the prescribed question that is exhausted. If you go back to the bike-share data and ask something operational the brief never raised, you now own the framing even if the source is shared.
- Replace it. One self-sourced project outranks three guided ones, and it is the only category of project that proves you can choose a question.
Choosing a project that does not look like a tutorial
The tells are specific, and reviewers read them quickly. A project reads as coursework when:
- The dataset arrived clean. Real data has duplicate customer records, three spellings of the same city and a column that is a date for most rows and free text for the rest. If your cleaning section is four lines, the data was prepared for you, and the hardest part of the job has been skipped.
- The "insights" restate the chart. "Sales are highest in Q4" is a description of a bar being taller. An insight is what the business should do differently, and what it would cost.
- The recommendation has no price. "Increase marketing spend in the Northeast" is a sentence anyone could write. "Shifting roughly a fifth of the regional budget would cost about X and, on these conversion rates, pays for itself if it holds for two quarters" is an analyst's sentence.
- Every project uses a different tool and each is used once. Five projects that are Python, then SQL, then Tableau, then Excel, then R read as a skills checklist rather than as work. Real analysts reuse their stack.
- The dashboard has fourteen KPIs and no stated audience. Every dashboard is built for somebody to make a decision with. Say who, and what decision.
The strongest projects almost always come from somewhere you already know something. A former nurse analysing appointment no-show patterns, a former teacher analysing timetable clashes, a former warehouse supervisor analysing pick-path efficiency — these beat another retail dashboard comprehensively, because the domain knowledge produces a question a generalist would not have asked. If you are changing careers, your previous career is the differentiator, not the thing to hide.
How to write a project up
Every guide tells you to "state the business problem". Almost none shows you the shape. Here is one that works, at roughly 300–500 words per project, plus charts.
The question, in one sentence, at the very top. Not the topic — the question. "Which of our delivery routes lose money, and why?" rather than "An analysis of delivery data".
The answer, immediately after it. Two or three sentences. You are not writing a mystery. A reviewer who reads only these two blocks should be able to describe your project to somebody else.
Where the data came from and what was wrong with it. Source, size, date range, and the two or three specific problems you had to solve. This is the section that separates people who have handled data from people who have loaded data.
What you did, briefly, with the reasoning. Not a method tour. The two or three decisions that could reasonably have gone another way, and why yours went the way it did. If you dropped rows, say how many and on what rule — you will be asked.
The finding, with a chart that is readable at a glance. One chart per point. Axis labels. A title that states the finding rather than naming the variables.
The recommendation and its cost. What should change, what it is worth, and what has to be true for that to hold.
What you would do differently. Two sentences. This is the single most persuasive paragraph in most portfolios, because it is the only one that proves you evaluated your own work.
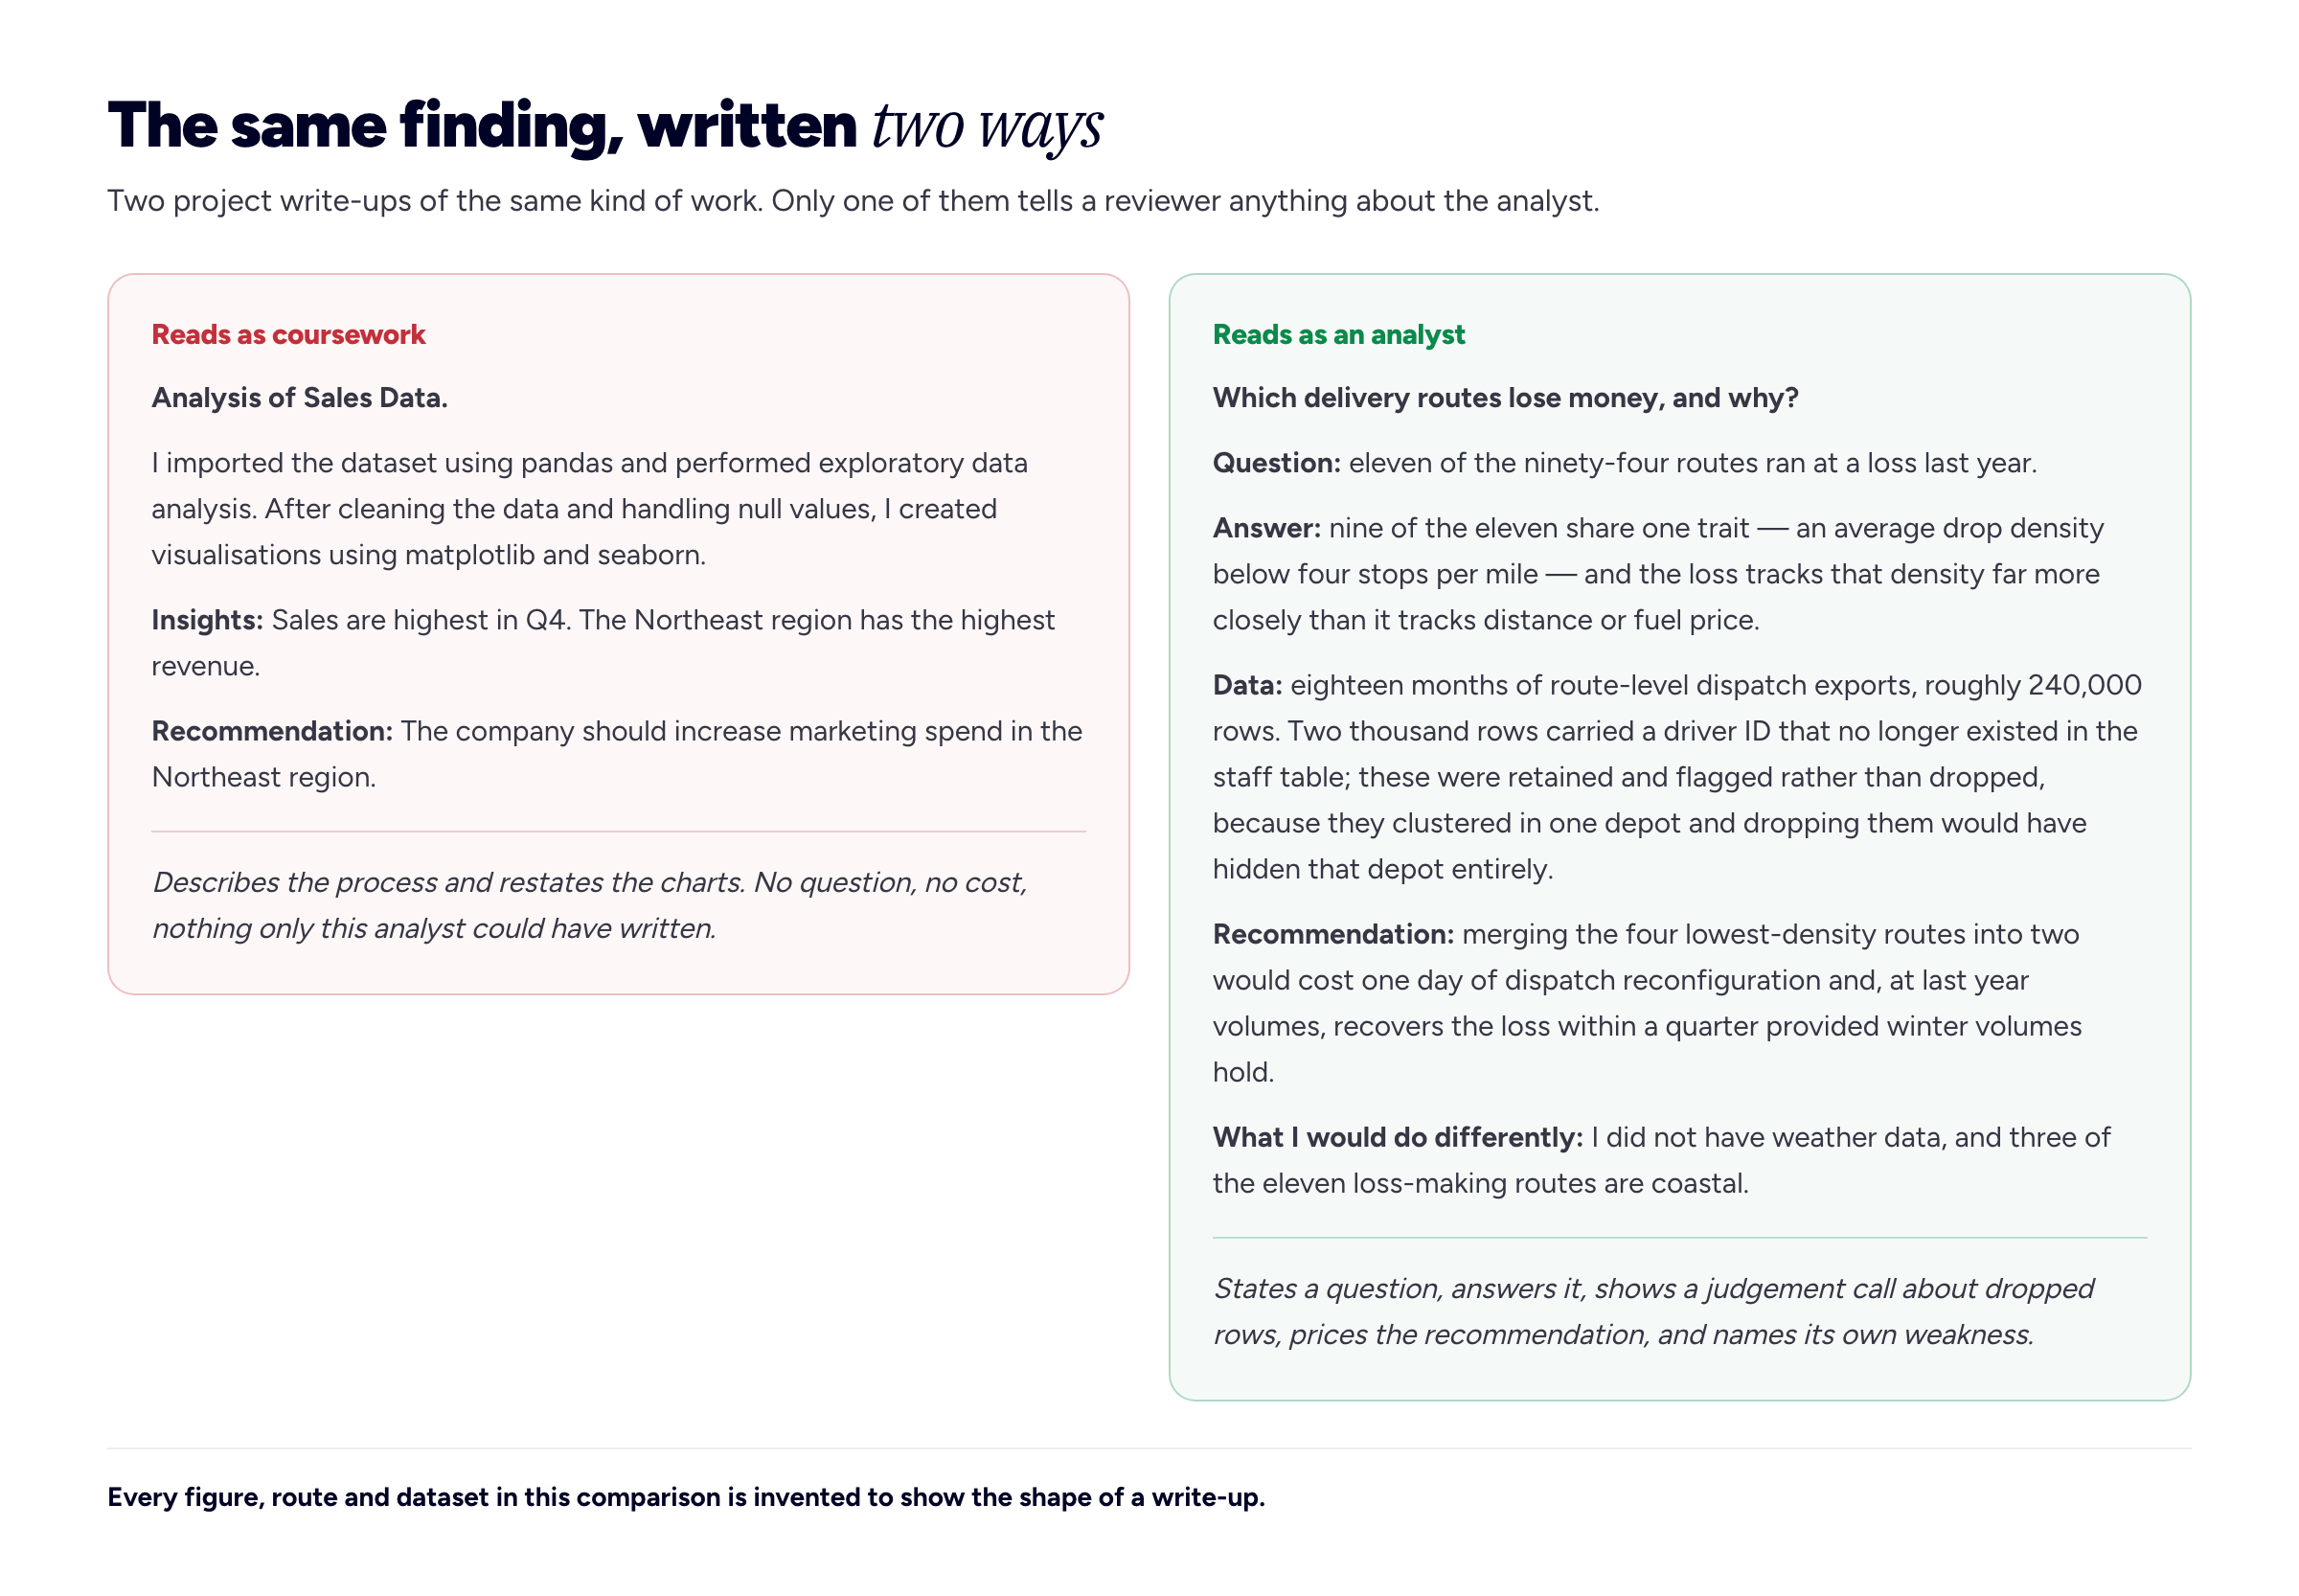
The difference is not writing ability. It is that the right-hand column makes claims that could be wrong, and the left-hand column makes none.
Work your employer owns
Almost every article on this subject is written for someone with no experience, which is why mid-career analysts find them useless. If you have been employed as an analyst for three years, your best work is the work you cannot show. Nothing in your employment contract anticipated a portfolio.
You have more options than "show it" or "omit it".
Describe the shape without the substance. You can almost always say what kind of problem it was, how large the data was, what you built and what changed, without naming the company, the product or the numbers. "A subscription business with roughly two million monthly active users" is not a disclosure. Check your contract, and when in doubt ask — a manager who says yes in writing is worth more than a guess.
Rebuild the analysis on public data with the same shape. This is the strongest option and almost nobody mentions it. The reasoning, the method and the judgement calls are yours; only the rows change. Say plainly that you have done this: "This reproduces an analysis I ran at work, on a public dataset with a similar structure, because the original data is confidential."
Redact axis values, keep the trend. An indexed chart where the baseline is 100 communicates the finding and discloses nothing. This is a normal convention in published research and it does not look evasive when labelled.
Get permission and keep it. If a client or employer is happy for you to publish, ask for it in an email and keep the email. Approval evaporates when the person who gave it leaves.
What you must not do is publish real internal figures and hope nobody notices. It is a firing offence at most employers, it is discoverable by exactly the people most likely to read your portfolio, and a reviewer who realises you have published a former employer's revenue has learned something about you that no project can offset. We have written separately about showing confidential work in a portfolio, which goes further into the contractual side.
Where to host it, decided rather than listed
Every competing article gives you the same list — GitHub Pages, Tableau Public, Kaggle, a personal site — and no basis for choosing. Here is the basis.
The decisive fact is one that the list-style articles never mention: two of the most commonly recommended hosts publish your underlying data, not just your charts.
Tableau's own documentation is explicit. On saving workbooks to Tableau Public, it states that workbooks and data published there "are not private and are freely accessible to anyone", and that anyone can interact with your views "or download your workbooks or data sources". You can hide a visualisation from your profile, but it remains reachable by URL.
Microsoft's warning on Publish to web from Power BI is blunter still: when you use it, "anyone on the Internet can view your published report or visual. Viewing requires no authentication. It includes viewing detail-level data that your reports aggregate. As a result, anyone can access the underlying data in your model even if your report does not display it."
Read that last clause again if you were planning to publish a dashboard built on anything derived from work data. Aggregation in the report is not protection; the model goes with it.
With that established, the choice is straightforward:
- GitHub is where your code should live, always. It is not, on its own, a portfolio — but a reviewer will look, and a repository with a real README, a clear structure and commits that are not all titled "update" is itself evidence.
- Tableau Public and Power BI Publish to web are excellent for genuinely public data and unacceptable for anything else. Use them as embeds, not as your address.
- Kaggle reaches other analysts, which is useful for feedback and nearly useless for hiring. Reviewers rarely go there.
- Your own domain is what you put on your CV. A
github.ioaddress reads as a student project to a non-technical hiring manager;yourname.comreads as a professional. Dashboards embed into it, so this is not a choice between the two — it is the question of which URL you own and which one you hand out.
That last point is the whole argument for having a site of your own rather than a profile on someone else's platform, and it applies well beyond data work — we make the general case in our guide to portfolio platforms versus your own website.
How many projects
The published answers range from two to six and none of them justify the number. The honest rule is different in kind: your portfolio is judged by its weakest visible project, so the right count is however many you would be happy to defend line by line in an interview.
For most people that is three. Occasionally it is one, if that one is genuinely substantial. It is almost never six, because the sixth is always the one where you cannot remember why you dropped those rows, and that is the one you will be asked about.
A useful test before publishing: for each project, can you answer, without notes — why this question, where the data came from, what you cleaned and on what rule, what you would do differently, and what the recommendation would cost to implement? If not, that project is not ready. Remove it or fix it; do not ship it in the hope that nobody opens it.
After it works
The portfolio's job ends when the interview starts, and the interview will be partly about the portfolio. Expect to be asked why you dropped those two thousand rows, why you chose a median over a mean, what would change your conclusion, and what you would need to be confident. These are not traps. They are the questions the write-up invited by making a claim.
There is a specific argument in favour of analysts taking the portfolio more seriously than most other professions do, and it is this: a data analyst is hired to make findings legible to people who cannot read the underlying work. That is the job. The portfolio is a sample of you doing exactly it, on a task where the reader is unfamiliar, distracted and short of time. Getting it wrong is not merely a missed opportunity to present your work; it is a demonstration of the skill you are claiming to have.
Worth noting on titles and expectations: the US Bureau of Labor Statistics does not publish a separate "data analyst" occupation. The closest is Data Scientists, which reports a median pay of $120,230 a year in 2025, 275,600 jobs, and projected growth of 35% between 2025 and 2035 — a figure that covers a broader and generally more senior category than most analyst roles. Treat it as a direction of travel for the field rather than as a salary benchmark for a job titled "data analyst".
Frequently asked questions
What should a data analyst portfolio include?
A short introduction that says what kind of problems you work on, two to four projects each written as question, answer, data, method, finding, recommendation and limitation, a link to your code, and an obvious way to contact you. Skills belong in a short list, not a rated bar chart. Certificates belong near the bottom.
How do I build a data analyst portfolio with no experience?
Source your own dataset and ask your own question, rather than completing a guided project that hundreds of thousands of other people have also completed. Use a domain you already know from previous work or from a genuine interest, because that is where you will ask a question a generalist would not. One self-sourced project is worth more than three tutorials.
How many projects should a data analyst portfolio have?
Usually three. The binding constraint is not the count but the floor: the portfolio is judged by its weakest visible project, so include only work you could defend in detail under questioning.
Is GitHub enough, or do I need a website?
GitHub is where the code belongs and reviewers do look at it, but a repository is not a portfolio — it opens on a file tree rather than on a finding. A small site that presents two or three projects properly, links to the repositories, and lives on a domain you own is what you put on your CV. The CV itself is a separate piece of work, and a free CV builder will get you a plain one-page PDF with the portfolio address both typed out and linked.
Can I put work from my job in my portfolio?
Not the data or the figures, unless you have written permission. You can usually describe the problem, the scale and the outcome without identifying details, and the strongest option is to rebuild the analysis on a public dataset of similar shape and say clearly that you have done so.
Is Tableau Public safe for a work-related dashboard?
No. Tableau's documentation states that workbooks and data published there are freely accessible and downloadable by anyone. Power BI's Publish to web carries an even stronger warning, because the underlying model travels with the report even when the report only shows aggregates. Both are fine for public data and unsuitable for anything else.
Should I include the Google certificate capstone?
You can, but not first. Its guided track is one of the most widely submitted projects in the field, so it demonstrates completion rather than distinguishing you. Put a self-sourced project at the top and let the capstone sit lower down.
Do I need to show Python, R, SQL, Excel and a BI tool?
No, and a portfolio where each project uses a different tool exactly once reads as a checklist rather than as work. Show the stack you would actually use on the job, used well, and name the rest in a skills line.
How we put this guide together
Bunfolio builds portfolio sites, so a great deal of our time goes on reading what people publish about themselves and working out where a page loses its reader. The frameworks here are our own recommendations rather than industry standards, and you should weigh them as judgement rather than as fact: the review sequence at the top, the seven-part project write-up, the "judged by its weakest project" rule for deciding how many to include, the argument that a rebuilt public-data version of confidential work is the strongest option available, and the list of tells that make a project read as coursework. They come from a consistent pattern in what makes a reader keep scrolling — a stated question and a priced recommendation do the most good, and a process tour with no claim in it does the most harm.
We have deliberately not cited any figure for how long a recruiter spends looking at a portfolio, how many analysts have one, or what percentage of hires involve a portfolio review. Numbers of that kind circulate widely in this topic and we could not trace them to a primary study we would be willing to stand behind. An invented statistic in a guide about analytical honesty would be a strange thing to publish, so the gap stays.
Where a factual claim is made it points at a primary source. The enrolment figure and the two capstone tracks come from the course page for the Google Data Analytics Capstone itself and will drift upward over time. The hosting warnings are quoted from the vendors' own documentation — Tableau's page on saving workbooks to Tableau Public and Microsoft's Publish to web documentation — rather than from summaries of them, because this is precisely the kind of claim that degrades when it is paraphrased. The occupational figures are from the BLS Occupational Outlook Handbook entry for Data Scientists, and we have flagged rather than hidden the fact that it is not an entry for data analysts. The characterisation of tutorial projects draws on Vinod Chugani's piece for Statology, quoted and linked rather than absorbed.
Every dataset, route, figure and recommendation used as an example above is invented for illustration — the delivery routes, the row counts, the depots, the drop densities and everything in both diagrams. They exist to demonstrate the shape of a well-written project entry. They do not report anything that happened, and none of the example copy should be reused as a claim about real work.
Related reading: how to write a portfolio case study for the longer-form version of the write-up structure, showing confidential work for the contractual side of the employer-data problem, building a portfolio with no experience if you are starting from nothing, and what hiring managers look for in a developer portfolio for the adjacent technical discipline.
More from the blog
November 4, 2026 · 18 min read
How to Become a Model: An Honest, Safety-First Guide
Pick the kind of modelling that fits you, take plain digitals agencies can use, submit for free, and check every agency before you sign. What fashion, commercial, fitness, parts, curve and mature work...
October 25, 2026 · 18 min read
What to Wear to an Interview: Read the Dress Code First
Wear what the team wears on a good day, one notch smarter, in clean clothes you can walk and sit in. How to find out an employer's real dress code before the day, what one notch above means sector by...
October 1, 2026 · 16 min read
Freelancing Tips: 29 Practical Habits From First Client to Tax
The freelancing habits that prevent most problems before they start, grouped by stage from setting up to looking after yourself. Each of the 29 tips comes with a concrete action, a template line you c...